Short Answer
TABLE 17-6
The maker of a packaged candy wants to evaluate the quality of her production process. On each of 16 consecutive days, she samples 600 bags of candy and determines the number in each day's sample that she considers to be of poor quality. The data that she developed follow. 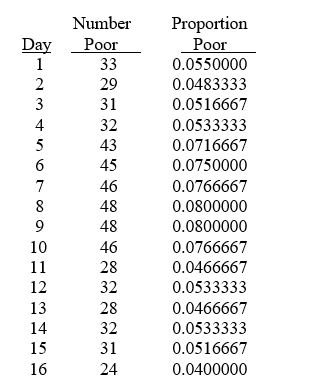
-Referring to Table 17-6, a p control chart is to be constructed for these data. The center line for the chart should be located at ________.
Correct Answer:

Verified
Correct Answer:
Verified
Q46: Once the control limits are set for
Q113: TABLE 17-1<br>A local newspaper has 10 delivery
Q114: TABLE 17-10<br>Below is the number of defective
Q115: Referring to Table 17-4, what is the
Q116: Referring to Table 17-4, what is the
Q117: TABLE 17-9<br>The manufacturer of canned food constructed
Q119: TABLE 17-3<br>A quality control analyst for a
Q120: Referring to Table 17-4, what is the
Q121: Referring to Table 17-4, suppose the supervisor
Q123: TABLE 17-9<br>The manufacturer of canned food constructed