Essay
TABLE 17-6
The maker of a packaged candy wants to evaluate the quality of her production process. On each of 16 consecutive days, she samples 600 bags of candy and determines the number in each day's sample that she considers to be of poor quality. The data that she developed follow. 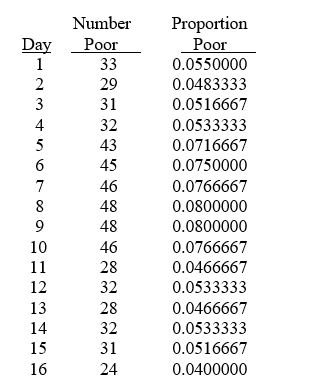
-Referring to Table 17-6, construct a p control chart for these data.
Correct Answer:

Verified
P Chart: S...View Answer
Unlock this answer now
Get Access to more Verified Answers free of charge
Correct Answer:
Verified
View Answer
Unlock this answer now
Get Access to more Verified Answers free of charge
Q91: Special or assignable causes of variation are
Q99: TABLE 17-4<br>A factory supervisor is concerned that
Q100: Referring to Table 17-7, what is the
Q102: Cpk > 1 indicates that the process
Q103: TABLE 17-3<br>A quality control analyst for a
Q105: TABLE 17-8<br>Recently, a university switched to a
Q106: TABLE 17-6<br>The maker of a packaged candy
Q108: TABLE 17-4<br>A factory supervisor is concerned that
Q109: It is not possible for the <img
Q122: The principal focus of the control chart