Essay
TABLE 17-8
Recently, a university switched to a new type of computer-based registration. The registrar is concerned with the amount of time students are spending on the computer registering under the new system. She decides to randomly select 8 students on each of the 12 days of the registration and determine the time each spends on the computer registering. The range, mean, and standard deviation of the times required to register are in the table that follows. 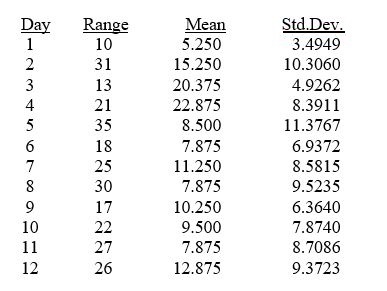
-Referring to Table 17-8, construct an R chart for the time required to register.
Correct Answer:

Verified
Correct Answer:
Verified
Q42: Variation signaled by individual fluctuations or patterns
Q91: Special or assignable causes of variation are
Q100: Referring to Table 17-7, what is the
Q102: Cpk > 1 indicates that the process
Q103: TABLE 17-3<br>A quality control analyst for a
Q104: TABLE 17-6<br>The maker of a packaged candy
Q106: TABLE 17-6<br>The maker of a packaged candy
Q108: TABLE 17-4<br>A factory supervisor is concerned that
Q109: It is not possible for the <img
Q122: The principal focus of the control chart