Essay
TABLE 16-1
The number of cases of chardonnay wine sold by a Paso Robles winery in an 8-year period follows. 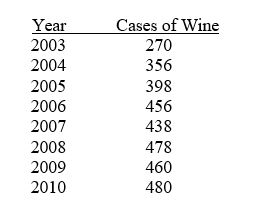
-Referring to Table 16-1, set up a scatter diagram (i.e., a time-series plot) with year on the horizontal X-axis.
Correct Answer:

Verified
Correct Answer:
Verified
Q25: A trend is a persistent pattern in
Q48: TABLE 16-13<br>Given below is the monthly time-series
Q49: TABLE 16-7<br>The executive vice-president of a drug
Q50: TABLE 16-13<br>Given below is the monthly time-series
Q51: TABLE 16-5<br>The number of passengers arriving at
Q52: TABLE 16-10<br>Business closures in Laramie, Wyoming from
Q54: TABLE 16-10<br>Business closures in Laramie, Wyoming from
Q55: TABLE 16-11<br>The manager of a health club
Q56: TABLE 16-14<br>A contractor developed a multiplicative time-series
Q58: TABLE 16-9<br>Given below are Excel outputs for