Multiple Choice
TABLE 16-5
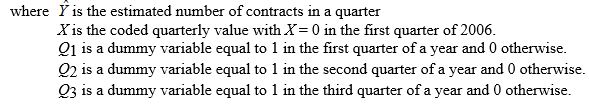
A contractor developed a multiplicative time-series model to forecast the number of contracts in future quarters, using quarterly data on number of contracts during the 3-year period from 2006 to 2008. The following is the resulting regression equation:

-Referring to Table 16-5, in testing the coefficient of X in the regression equation (0.117) the results were a t-statistic of 9.08 and an associated p-value of 0.0000. Which of the following is the best interpretation of this result?
A) The quarterly growth rate in the number of contracts is significantly different from 0% (α = 0.05) .
B) The quarterly growth rate in the number of contracts is not significantly different from 0% (α = 0.05) .
C) The quarterly growth rate in the number of contracts is significantly different from 100% (α = 0.05) .
D) The quarterly growth rate in the number of contracts is not significantly different from 100% (α = 0.05) .
Correct Answer:

Verified
Correct Answer:
Verified
Q15: TABLE 16-11 <br> <span class="ql-formula"
Q38: TABLE 16-6<br>The number of cases of merlot
Q39: TABLE 16-9<br>The executive vice-president of a drug
Q40: Microsoft Excel was used to obtain the
Q42: TABLE 16-13<br>A local store developed a multiplicative
Q44: The cyclical component of a time series<br>A)
Q46: TABLE 16-5<br>A contractor developed a multiplicative time-series
Q47: A second-order autoregressive model for average mortgage
Q110: TABLE 16-12<br>The manager of a health
Q154: TABLE 16-7<br>The number of passengers arriving at