Multiple Choice
TABLE 16-5
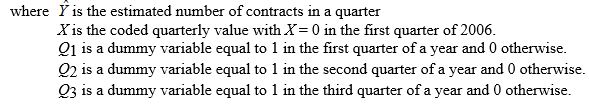
A contractor developed a multiplicative time-series model to forecast the number of contracts in future quarters, using quarterly data on number of contracts during the 3-year period from 2006 to 2008. The following is the resulting regression equation:

-Referring to Table 16-5, in testing the coefficient for Q1 in the regression equation (-0.083) , the results were a t-statistic of -0.66 and an associated p-value of 0.530. Which of the following is the best interpretation of this result?
A) The number of contracts in the first quarter of the year is significantly different from the number of contracts in an average quarter (α = 0.05) .
B) The number of contracts in the first quarter of the year is not significantly different from the number of contracts in an average quarter (α = 0.05) .
C) The number of contracts in the first quarter of the year is significantly different from the number of contracts in the fourth quarter for a given coded quarterly value of X (α = 0.05) .
D) The number of contracts in the first quarter of the year is not significantly different from the number of contracts in the fourth quarter for a given coded quarterly value of X (α = 0.05) .
Correct Answer:

Verified
Correct Answer:
Verified
Q6: TABLE 16-3<br>The following table contains the number
Q35: The annual multiplicative time-series model does not
Q43: TABLE 16-12 <br>The manager of
Q53: TABLE 16-1<br>The number of cases of chardonnay
Q123: TABLE 16-3<br>The following table contains the number
Q124: TABLE 16-8<br>The president of a chain of
Q127: TABLE 16-4<br>Given below are EXCEL outputs for
Q128: TABLE 16-6<br>The number of cases of merlot
Q130: The MAD is a measure of the
Q133: TABLE 16-9<br>The executive vice-president of a drug