Multiple Choice
TABLE 16-13
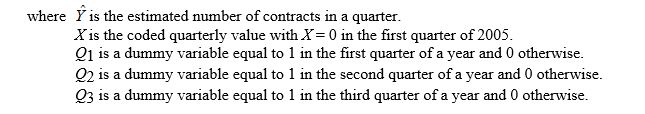
A local store developed a multiplicative time-series model to forecast its revenues in future quarters, using quarterly data on its revenues during the 4-year period from 2005 to 2009. The following is the resulting regression equation:

-Referring to Table 16-13, the best interpretation of the coefficient of X (0.012) in the regression equation is:
A) the quarterly compound growth rate in revenues is around 2.8%.
B) the annual growth rate in revenues is around 2.8%.
C) the quarterly growth rate in revenues is around 1.2%.
D) the annual growth rate in revenues is around 1.2%.
Correct Answer:

Verified
Correct Answer:
Verified
Q40: TABLE 16-8 <br>The president of a
Q52: Which of the following statements about moving
Q66: TABLE 16-8<br>The president of a chain of
Q67: TABLE 16-10<br>The manager of a marketing consulting
Q69: TABLE 16-10<br>The manager of a marketing consulting
Q72: TABLE 16-8<br>The president of a chain of
Q114: TABLE 16-11 <br> Business closures in
Q138: TABLE 16-11 <br>Business closures in Laramie,
Q147: A model that can be used to
Q149: TABLE 16-7<br>The number of passengers arriving at