Multiple Choice
TABLE 16-13
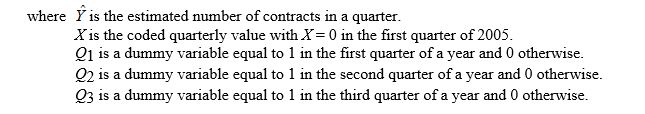
A local store developed a multiplicative time-series model to forecast its revenues in future quarters, using quarterly data on its revenues during the 4-year period from 2005 to 2009. The following is the resulting regression equation:

-Referring to Table 16-13, the best interpretation of the coefficient of Q2 (-0.054) in the regression equation is:
A) the revenues in the second quarter of a year is approximately 5.4% lower than the average over all 4 quarters.
B) the revenues in the second quarter of a year is approximately 5.4% lower than it would be during the fourth quarter.
C) the revenues in the second quarter of a year is approximately 11.69% lower than the average over all 4 quarters.
D) the revenues in the second quarter of a year is approximately 11.69% lower than it would be during the fourth quarter.
Correct Answer:

Verified
Correct Answer:
Verified
Q25: TABLE 16-3<br>The following table contains the number
Q25: A trend is a persistent pattern in
Q25: Which of the following methods should not
Q32: After estimating a trend model for annual
Q35: TABLE 16-6<br>The number of cases of merlot
Q52: The overall upward or downward pattern of
Q63: Given a data set with 15 yearly
Q119: TABLE 16-7<br>The number of passengers arriving at
Q124: TABLE 16-7<br>The number of passengers arriving at
Q185: TABLE 16-2 <br> The monthly advertising