Multiple Choice
TABLE 16-13
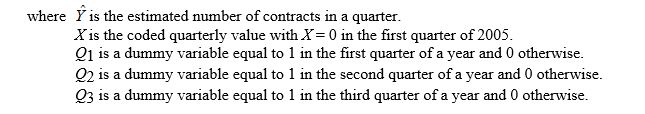
A local store developed a multiplicative time-series model to forecast its revenues in future quarters, using quarterly data on its revenues during the 4-year period from 2005 to 2009. The following is the resulting regression equation:

-Referring to Table 16-13, the best interpretation of the coefficient of Q3 (0.098) in the regression equation is:
A) the revenues in the third quarter of a year is approximately 9.8% higher than the average over all 4 quarters.
B) the revenues in the third quarter of a year is approximately 9.8% higher than it would be during the fourth quarter.
C) the revenues in the third quarter of a year is approximately 25.31% higher than the average over all 4 quarters.
D) the revenues in the third quarter of a year is approximately 25.31% higher than it would be during the fourth quarter.
Correct Answer:

Verified
Correct Answer:
Verified
Q78: When a time series appears to be
Q79: TABLE 16-6<br>The number of cases of merlot
Q80: TABLE 16-5<br>A contractor developed a multiplicative time-series
Q83: A first-order autoregressive model for stock sales
Q84: TABLE 16-10<br>The manager of a marketing consulting
Q85: TABLE 16-13<br>A local store developed a multiplicative
Q86: TABLE 16-13<br>A local store developed a multiplicative
Q86: TABLE 16-3<br>The following table contains the number
Q103: TABLE 16-1<br>The number of cases of chardonnay
Q129: TABLE 16-3<br>The following table contains the number