Solved

TABLE 15-2 In Hawaii,condemnation Proceedings Are Under Way to Enable Private Citizens

Question 87

Multiple Choice

TABLE 15-2
In Hawaii,condemnation proceedings are under way to enable private citizens to own the property that their homes are built on.Until recently,only estates were permitted to own land,and homeowners leased the land from the estate.In order to comply with the new law,a large Hawaiian estate wants to use regression analysis to estimate the fair market value of the land.The following model was fit to data collected for n = 20 properties,10 of which are located near a cove.
Model 1: Y = + β0 + β1X1 + β2X2 + β3 X1X2 + β4
TABLE 15-2 In Hawaii,condemnation proceedings are under way to enable private citizens to own the property that their homes are built on.Until recently,only estates were permitted to own land,and homeowners leased the land from the estate.In order to comply with the new law,a large Hawaiian estate wants to use regression analysis to estimate the fair market value of the land.The following model was fit to data collected for n = 20 properties,10 of which are located near a cove. Model 1: Y = + β<sub>0</sub> + β<sub>1</sub>X<sub>1</sub> + β<sub>2</sub>X<sub>2</sub> + β<sub>3</sub> X<sub>1</sub>X<sub>2 </sub>+ β<sub>4</sub> <sub> </sub>   + β<sub>S</sub> <sub> </sub>   X<sub>2</sub> + ε where Y = Sale price of property in thousands of dollars X<sub>1</sub> = Size of property in thousands of square feet X<sub>2</sub> = 1 if property located near cove,0 if not Using the data collected for the 20 properties,the following partial output obtained from Microsoft Excel is shown:   -Referring to Table 15-2,given a quadratic relationship between sale price (Y) and property size (X<sub>1</sub>) ,what null hypothesis would you test to determine whether the curves differ from cove and non-cove properties? A) H<sub>0</sub> : β<sub>2</sub> = β<sub>3</sub> = β<sub>5</sub> = 0 B) H<sub>0 </sub>: β<sub>4 </sub>= β<sub>5 </sub>= 0 C) H<sub>0 </sub>: β<sub>3</sub> = β<sub>5 </sub>= 0 D) H<sub>0</sub> : β<sub>2 </sub>= 0 + βS
TABLE 15-2 In Hawaii,condemnation proceedings are under way to enable private citizens to own the property that their homes are built on.Until recently,only estates were permitted to own land,and homeowners leased the land from the estate.In order to comply with the new law,a large Hawaiian estate wants to use regression analysis to estimate the fair market value of the land.The following model was fit to data collected for n = 20 properties,10 of which are located near a cove. Model 1: Y = + β<sub>0</sub> + β<sub>1</sub>X<sub>1</sub> + β<sub>2</sub>X<sub>2</sub> + β<sub>3</sub> X<sub>1</sub>X<sub>2 </sub>+ β<sub>4</sub> <sub> </sub>   + β<sub>S</sub> <sub> </sub>   X<sub>2</sub> + ε where Y = Sale price of property in thousands of dollars X<sub>1</sub> = Size of property in thousands of square feet X<sub>2</sub> = 1 if property located near cove,0 if not Using the data collected for the 20 properties,the following partial output obtained from Microsoft Excel is shown:   -Referring to Table 15-2,given a quadratic relationship between sale price (Y) and property size (X<sub>1</sub>) ,what null hypothesis would you test to determine whether the curves differ from cove and non-cove properties? A) H<sub>0</sub> : β<sub>2</sub> = β<sub>3</sub> = β<sub>5</sub> = 0 B) H<sub>0 </sub>: β<sub>4 </sub>= β<sub>5 </sub>= 0 C) H<sub>0 </sub>: β<sub>3</sub> = β<sub>5 </sub>= 0 D) H<sub>0</sub> : β<sub>2 </sub>= 0 X2 + ε
where Y = Sale price of property in thousands of dollars
X1 = Size of property in thousands of square feet
X2 = 1 if property located near cove,0 if not
Using the data collected for the 20 properties,the following partial output obtained from Microsoft Excel is shown: TABLE 15-2 In Hawaii,condemnation proceedings are under way to enable private citizens to own the property that their homes are built on.Until recently,only estates were permitted to own land,and homeowners leased the land from the estate.In order to comply with the new law,a large Hawaiian estate wants to use regression analysis to estimate the fair market value of the land.The following model was fit to data collected for n = 20 properties,10 of which are located near a cove. Model 1: Y = + β<sub>0</sub> + β<sub>1</sub>X<sub>1</sub> + β<sub>2</sub>X<sub>2</sub> + β<sub>3</sub> X<sub>1</sub>X<sub>2 </sub>+ β<sub>4</sub> <sub> </sub>   + β<sub>S</sub> <sub> </sub>   X<sub>2</sub> + ε where Y = Sale price of property in thousands of dollars X<sub>1</sub> = Size of property in thousands of square feet X<sub>2</sub> = 1 if property located near cove,0 if not Using the data collected for the 20 properties,the following partial output obtained from Microsoft Excel is shown:   -Referring to Table 15-2,given a quadratic relationship between sale price (Y) and property size (X<sub>1</sub>) ,what null hypothesis would you test to determine whether the curves differ from cove and non-cove properties? A) H<sub>0</sub> : β<sub>2</sub> = β<sub>3</sub> = β<sub>5</sub> = 0 B) H<sub>0 </sub>: β<sub>4 </sub>= β<sub>5 </sub>= 0 C) H<sub>0 </sub>: β<sub>3</sub> = β<sub>5 </sub>= 0 D) H<sub>0</sub> : β<sub>2 </sub>= 0
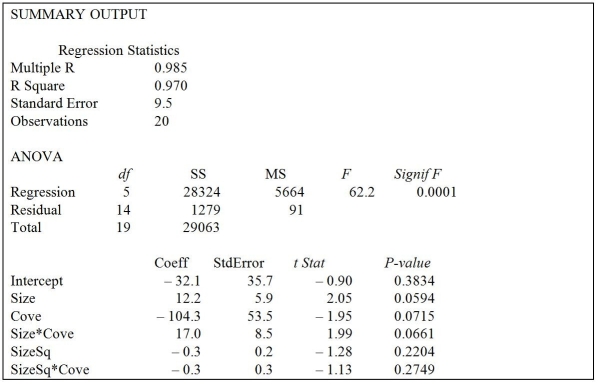
-Referring to Table 15-2,given a quadratic relationship between sale price (Y) and property size (X1) ,what null hypothesis would you test to determine whether the curves differ from cove and non-cove properties?


A) H0 : β2 = β3 = β5 = 0
B) H0 : β4 = β5 = 0
C) H0 : β3 = β5 = 0
D) H0 : β2 = 0

Correct Answer:

verifed

Verified

Unlock this answer now
Get Access to more Verified Answers free of charge

Related Questions