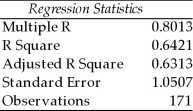
Multiple Choice
TABLE 15-5
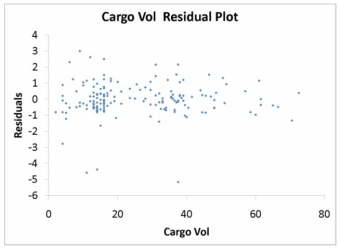
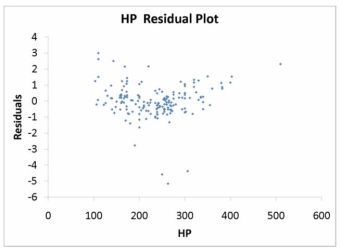
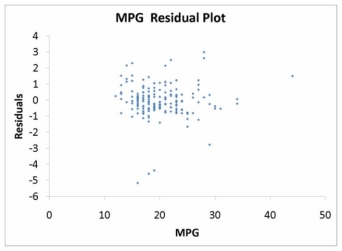
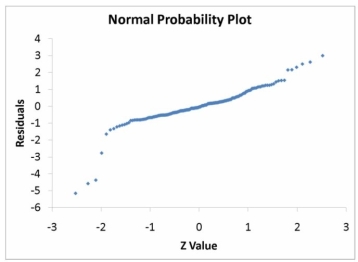
What are the factors that determine the acceleration time (in sec.) from 0 to 60 miles per hour of a car? Data on the following variables for 171 different vehicle models were collected:
Accel Time: Acceleration time in sec.
Cargo Vol: Cargo volume in cu. ft.
HP: Horsepower
MPG: Miles per gallon
SUV: 1 if the vehicle model is an SUV with Coupe as the base when SUV and Sedan are both 0
Sedan: 1 if the vehicle model is a sedan with Coupe as the base when SUV and Sedan are both 0
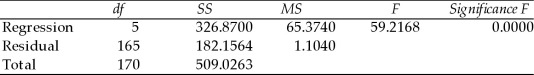
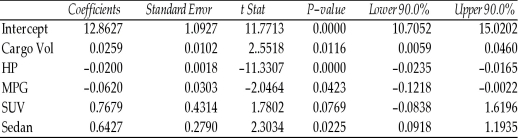
The regression results using acceleration time as the dependent variable and the remaining variables as the independent variables are presented below.
 ANOVA
ANOVA
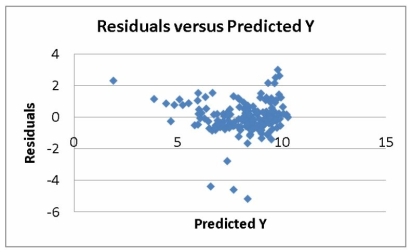
 The various residual plots are as shown below.
 The coefficient of partial determination (
  ) of each of the 5 predictors are, respectively, 0.0380, 0.4376, 0.0248, 0.0188, and 0.0312.
The coefficient of multiple determination for the regression model using each of the 5 variables as the dependent variable and all other X variables as independent variables (  ) are, respectively, 0.7461, 0.5676, 0.6764, 0.8582, 0.6632.
-Referring to Table 15-5, what is the correct interpretation for the estimated coefficient for MPG?
A) As the miles per gallon decreases by one unit, the mean 0 to 60 miles per hour acceleration time will increase by an estimated 0.0620 seconds without taking into consideration all the other independent variables included in the model.
B) As the 0 to 60 miles per hour acceleration time decreases by one second, the mean miles per gallon will increase by an estimated 0.0620 unit without taking into consideration all the other independent variables included in the model.
C) As the miles per gallon decreases by one unit, the mean 0 to 60 miles per hour acceleration time will increase by an estimated 0.0620 seconds taking into consideration all the other independent variables included in the model.
D) As the 0 to 60 miles per hour acceleration time decreases by one second, the mean miles per gallon will increase by an estimated 0.0620 unit taking into consideration all the other independent variables included in the model.
Correct Answer:

Verified
Correct Answer:
Verified
Q1: A real estate builder wishes to determine
Q4: TABLE 15-5<br>What are the factors that determine
Q8: TABLE 15-5<br>What are the factors that determine
Q9: TABLE 15-5<br>What are the factors that determine
Q10: TABLE 15-2<br>In Hawaii, condemnation proceedings are under
Q11: TABLE 15-5<br>What are the factors that determine
Q26: The logarithm transformation can be used<br>A)to overcome
Q48: TABLE 15-3<br>A chemist employed by a pharmaceutical
Q52: Collinearity is present when there is a
Q64: Using the best-subsets approach to model building,models