Short Answer
TABLE 3-8
The time period from 2006 to 2009 saw a great deal of volatility in the value of stocks. The data in the following table represent the total rate of return of our companies from 2006 to 2009.
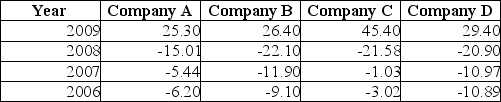
-Referring to Table 3-8, calculate the geometric mean rate of return for Company A.
Correct Answer:

Verified
Correct Answer:
Verified
Q33: The interquartile range is a measure of
Q38: TABLE 3-4<br>The ordered array below represents the
Q64: <span class="ql-formula" data-value="\text { TABLE 3-2 }"><span
Q78: TABLE 3-7<br>In a recent academic year, many
Q92: TABLE 3-7<br>In a recent academic year, many
Q95: The coefficient of variation measures variability in
Q96: In left-skewed distributions, the distance from the
Q98: The rate of return for the S&P
Q104: You were told that the 1st, 2nd,
Q115: TABLE 3-4<br>The ordered array below represents the