Short Answer
TABLE 3-8
The time period from 2006 to 2009 saw a great deal of volatility in the value of stocks. The data in the following table represent the total rate of return of our companies from 2006 to 2009.
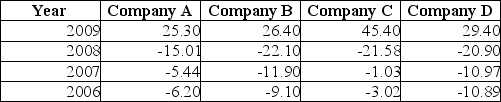
-Referring to Table 3-8, calculate the geometric mean rate of return for Company B.
Correct Answer:

Verified
Correct Answer:
Verified
Q3: The median of the values 3.4,4.7,1.9,7.6,and 6.5
Q29: If the distribution of a data set
Q63: <span class="ql-formula" data-value="\text { TABLE 3-1 }"><span
Q68: TABLE 3-1<br>Health care issues are receiving much
Q83: TABLE 3-4<br>The ordered array below represents the
Q123: You were told that the 1st, 2nd,
Q128: A manufacturer of flashlight batteries took a
Q130: In general, which of the following descriptive
Q163: The median of the values 3.4,4.7,1.9,7.6,and 6.5
Q185: The 5-number summary consists of the smallest