Short Answer
TABLE 3-8
The time period from 2006 to 2009 saw a great deal of volatility in the value of stocks. The data in the following table represent the total rate of return of our companies from 2006 to 2009.
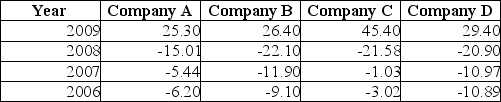
-Referring to Table 3-8, calculate the geometric mean rate of return for Company D.
Correct Answer:

Verified
Correct Answer:
Verified
Q35: TABLE 3-1<br>Health care issues are receiving
Q39: TABLE 3-4<br>The ordered array below represents the
Q82: Which of the following is sensitive to
Q83: In right-skewed distributions, which of the following
Q87: Which of the following is NOT a
Q93: As a general rule, an observation is
Q94: The larger the Z score, the farther
Q112: In a boxplot,the box portion represents the
Q139: TABLE 3-5<br>The rates of return of a
Q146: TABLE 3-4<br>The ordered array below represents the