Multiple Choice
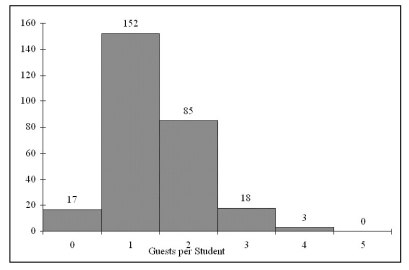
TABLE 2-4
Every spring semester, the School of Business coordinates with local business leaders a luncheon for graduating seniors, their families, and friends. Corporate sponsorship pays for the lunches of each of the seniors, but students have to purchase tickets to cover the cost of lunches served to guests they bring with them. The following histogram represents the attendance at the senior luncheon, where X is the number of guests each graduating senior invited to the luncheon and f is the number of graduating seniors in each category.
-A professor of economics at a small Texas university wanted to determine what year in school students were taking his tough economics course. Shown below is a pie chart of the results. What percentage of the class took the course prior to reaching their senior year? 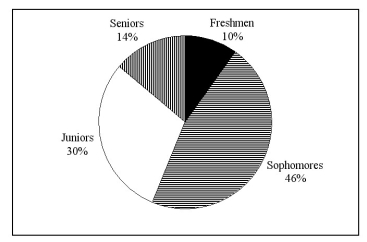
A) 14%
B) 44%
C) 54%
D) 86%
Correct Answer:

Verified
Correct Answer:
Verified
Q86: The level of satisfaction ("Very unsatisfied","Fairly unsatisfied","Fairly
Q115: The Dean of Students conducted a survey
Q125: A survey of 150 executives were asked
Q154: Which of the following is appropriate for
Q218: TABLE 2-6<br>The following are the durations in
Q220: The chancellor of a major university was
Q221: TABLE 2-9<br>The Stem-and-Leaf display represents the number
Q223: TABLE 2-9<br>The Stem-and-Leaf display represents the number
Q225: TABLE 2-14<br>Given below is the stem-and-leaf display
Q227: TABLE 2-13<br>The table below contains the opinions