Short Answer
TABLE 2-11
The histogram below represents scores achieved by 200 job applicants on a personality profile.
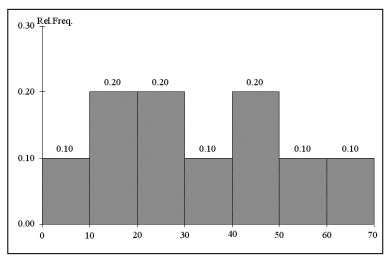
-Referring to the histogram from Table 2-11, ________ percent of the job applicants scored below 50.
Correct Answer:

Verified
Correct Answer:
Verified
Related Questions
Q42: A good choice for the number of
Q127: Data on the number of part-time hours
Q146: Faculty rank (professor to lecturer)is an example
Q229: TABLE 2-1<br>The manager of the customer service
Q230: TABLE 2-1<br>The manager of the customer service
Q232: TABLE 2-12<br>The ordered array below resulted from
Q234: TABLE 2-6<br>The following are the durations in
Q235: When studying the simultaneous responses to two
Q236: TABLE 2-1<br>The manager of the customer service
Q237: TABLE 2-1<br>The manager of the customer service