Short Answer
TABLE 2-11
The histogram below represents scores achieved by 200 job applicants on a personality profile.
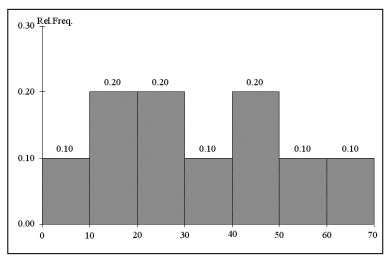
-Referring to the histogram from Table 2-11, the number of job applicants who scored 50 or above is ________.
Correct Answer:

Verified
Correct Answer:
Verified
Q72: The date when a production line in
Q95: When constructing a frequency distribution, classes should
Q100: TABLE 2-6<br>The following are the durations in
Q101: TABLE 2-13<br>The table below contains the opinions
Q102: TABLE 2-18<br>The following table presents total retail
Q103: TABLE 2-8<br>The Stem-and-Leaf display below contains data
Q104: TABLE 2-14<br>Given below is the stem-and-leaf display
Q106: TABLE 2-13<br>The table below contains the opinions
Q109: You have collected data on the annual
Q143: Researchers are concerned that the weight of