Short Answer
TABLE 2-11
The histogram below represents scores achieved by 200 job applicants on a personality profile.
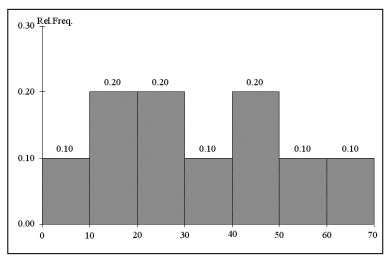
-Referring to the histogram from Table 2-11, 90% of the job applicants scored above or equal to ________.
Correct Answer:

Verified
Correct Answer:
Verified
Related Questions
Q14: In general,grouped frequency distributions should have between
Q22: Data on the number of credit hours
Q26: The answer to the question "What is
Q67: To monitor campus security, the campus police
Q76: TABLE 2-15<br>The table below contains the number
Q79: The answer to the question "How do
Q83: TABLE 2-10<br>The frequency distribution below represents the
Q84: TABLE 2-10<br>The frequency distribution below represents the
Q140: The sum of cumulative frequencies in a
Q181: The personnel director at a large company