Short Answer
TABLE 2-11
The histogram below represents scores achieved by 200 job applicants on a personality profile.
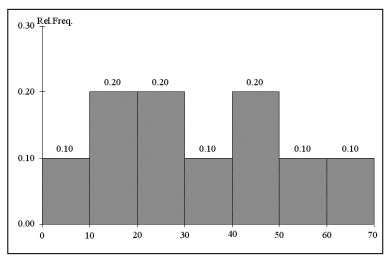
-Referring to the histogram from Table 2-11, half of the job applicants scored below ________.
Correct Answer:

Verified
Correct Answer:
Verified
Related Questions
Q78: Most colleges admit students based on their
Q101: The sum of relative frequencies in a
Q157: TABLE 2-13<br>The table below contains the opinions
Q160: TABLE 2-13<br>The table below contains the opinions
Q163: TABLE 2-15<br>The table below contains the number
Q165: TABLE 2-15<br>The table below contains the number
Q166: The Dean of Students conducted a survey
Q167: Student grades (A to F)are an example
Q167: TABLE 2-10<br>The frequency distribution below represents the
Q182: A statistics student found a reference in