Short Answer
TABLE 2-11
The histogram below represents scores achieved by 200 job applicants on a personality profile.
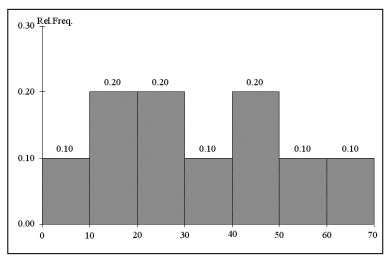
-Referring to the histogram from Table 2-11, ________ percent of the applicants scored below 20 or at least 50.
Correct Answer:

Verified
Correct Answer:
Verified
Q28: Most colleges admit students based on their
Q47: The point halfway between the boundaries of
Q61: The classification of student class designation (freshman,
Q90: TABLE 2-14<br>Given below is the stem-and-leaf display
Q94: TABLE 2-3<br>At a meeting of information systems
Q99: TABLE 2-1<br>The manager of the customer service
Q100: TABLE 2-6<br>The following are the durations in
Q118: A histogram can have gaps between the
Q134: The amount of calories contained in a
Q183: Apple Computer, Inc. collected information on the