Multiple Choice
TABLE 2-16
The figure below is the ogive for the amount of fat (in grams) for a sample of 36 pizza products where the upper boundaries of the intervals are: 5, 10, 15, 20, 25, and 30.
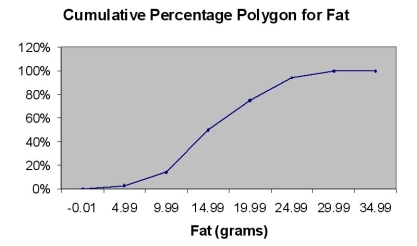
-Referring to Table 2-16, roughly what percentage of pizza products contains less than 10 grams of fat?
A) 3%
B) 14%
C) 50%
D) 75%
Correct Answer:

Verified
Correct Answer:
Verified
Q18: Most colleges admit students based on their
Q86: The percentage polygon is formed by having
Q124: The level of satisfaction ("Very unsatisfied","Fairly unsatisfied","Fairly
Q127: In purchasing an automobile, there are a
Q174: A Wal-Mart store in a small town
Q202: An insurance company evaluates many numerical variables
Q245: TABLE 2-10<br>The frequency distribution below represents the
Q247: TABLE 2-15<br>The table below contains the number
Q252: TABLE 2-12<br>The ordered array below resulted from
Q254: TABLE 2-2<br>An insurance company evaluates many numerical