Multiple Choice
TABLE 2-16
The figure below is the ogive for the amount of fat (in grams) for a sample of 36 pizza products where the upper boundaries of the intervals are: 5, 10, 15, 20, 25, and 30.
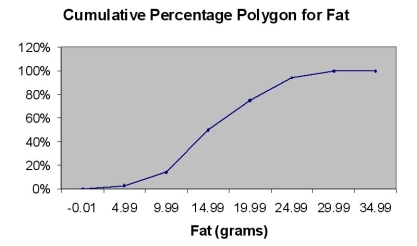
-Referring to Table 2-16, what percentage of pizza products contains between 10 and 25 grams of fat?
A) 14%
B) 44%
C) 62%
D) 81%
Correct Answer:

Verified
Correct Answer:
Verified
Q5: A personal computer user survey was conducted.Hours
Q107: The Dean of Students conducted a survey
Q114: In graphing bivariate categorical data, the side-by-side
Q130: TABLE 2-14<br>Given below is the stem-and-leaf display
Q131: TABLE 2-13<br>The table below contains the opinions
Q132: TABLE 2-9<br>The Stem-and-Leaf display represents the number
Q133: TABLE 2-14<br>Given below is the stem-and-leaf display
Q138: TABLE 2-9<br>The Stem-and-Leaf display represents the number
Q139: TABLE 2-13<br>The table below contains the opinions
Q140: TABLE 2-7<br>A sample of 200 students at