Multiple Choice
TABLE 2-17
The figure below is the percentage polygon for the amount of calories for a sample of 36 pizzas products where the upper limits of the intervals are: 310, 340, 370, 400 and 430.
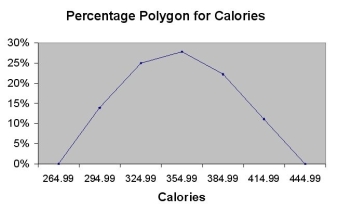
-Referring to Table 2-17, roughly what percentage of pizza products contains at least 340 calories?
A) 25%
B) 28%
C) 39%
D) 61%
Correct Answer:

Verified
Correct Answer:
Verified
Q43: The stem-and-leaf display is often superior to
Q64: The classification of student major (accounting, economics,
Q77: A personal computer user survey was conducted.The
Q113: TABLE 2-14<br>Given below is the stem-and-leaf display
Q116: TABLE 2-9<br>The Stem-and-Leaf display represents the number
Q116: The original data values cannot be assessed
Q120: TABLE 2-15<br>The table below contains the number
Q122: TABLE 2-15<br>The table below contains the number
Q141: Data on 1,500 students' height were collected
Q175: To evaluate two categorical variables at the