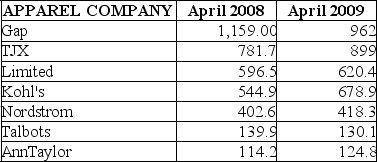
menu-iconExamlexExamLexServices

Discover

Ask a Question
  1. All Topics
  2. Topic
    Statistics
  3. Study Set
    Statistics for Managers
  4. Exam
    Exam 2: Presenting Data in Tables and Charts
  5. Question
    TABLE 2-18 the Following Table Presents Total Retail Sales in Millions of Millions
Solved

TABLE 2-18 the Following Table Presents Total Retail Sales in Millions of Millions

Question 240

Question 240

Essay

TABLE 2-18
The following table presents total retail sales in millions of dollars for the leading apparel companies during April 2008 and April 2009.
TABLE 2-18 The following table presents total retail sales in millions of dollars for the leading apparel companies during April 2008 and April 2009.    -Referring to Table 2-18, construct a side-by-side bar chart.
-Referring to Table 2-18, construct a side-by-side bar chart.

Correct Answer:

verifed

Verified

Unlock this answer now
Get Access to more Verified Answers free of charge

Related Questions

Q2: To determine the width of class interval,

Q42: A good choice for the number of

Q235: When studying the simultaneous responses to two

Q236: TABLE 2-1<br>The manager of the customer service

Q237: TABLE 2-1<br>The manager of the customer service

Q239: TABLE 2-6<br>The following are the durations in

Q241: TABLE 2-18<br>The following table presents total retail

Q242: You have collected data on the approximate

Q243: TABLE 2-1<br>The manager of the customer service

Q245: TABLE 2-10<br>The frequency distribution below represents the

Examlex

ExamLex

About UsContact UsPerks CenterHomeschoolingTest Prep

Work With Us

Campus RepresentativeInfluencers

Links

FaqPricingChrome Extension

Download The App

Get App StoreGet Google Play

Policies

Privacy PolicyTerms of ServiceHonor CodeCommunity Guidelines

Scan To Download

qr-code

Copyright © (2025) ExamLex LLC.

Privacy PolicyTerms Of ServiceHonor CodeCommunity Guidelines