Multiple Choice
Figure 5.7
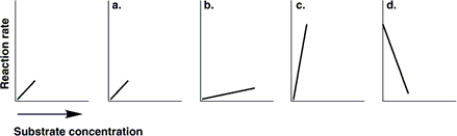
-The graph at the left in Figure 5.7 shows the reaction rate for an enzyme at its optimum temperature. Which graph shows enzyme activity at a higher temperature?
A) a
B) b
C) c
D) d
Correct Answer:

Verified
Correct Answer:
Verified
Related Questions
Q23: Which of the following is NOT necessary
Q24: Which organism is NOT correctly matched to
Q25: Which of the following statements are true?
Q26: Gallionella bacteria can get energy from the
Q29: Which of the following is the best
Q30: A strictly fermentative bacterium produces energy<br>A) by
Q31: Figure 5.2<br> <img src="https://d2lvgg3v3hfg70.cloudfront.net/TB2887/.jpg" alt="Figure 5.2
Q32: The advantage of the pentose phosphate pathway
Q33: Which of the following uses CO<sub>2 </sub>for
Q63: Glycolysis is utilized by cells in both