Multiple Choice
Figure 5.5
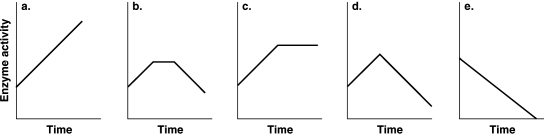
-Which of the graphs in Figure 5.5 best illustrates the activity of an enzyme that is saturated with substrate?
A) a
B) b
C) c
D) d
E) e
Correct Answer:

Verified
Correct Answer:
Verified
Related Questions
Q5: Figure 5.8<br> <img src="https://d2lvgg3v3hfg70.cloudfront.net/TB6915/.jpg" alt="Figure 5.8
Q36: An enzyme, citrate synthase, in the Krebs
Q37: A urease test is used to identify
Q38: Which of the following statements regarding metabolism
Q39: In noncyclic photophosphorylation, O<sub>2 </sub>is released from<br>A)
Q42: Which of the following statements about substrate-
Q44: Microorganisms that catabolize sugars into ethanol and
Q45: Assume you are working for a chemical
Q46: Streptococcus lacks an electron transport chain.How does
Q54: The use of enzymes is necessary to