Multiple Choice
Exhibit 20-5
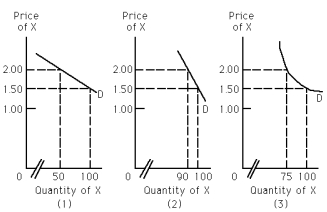
-Refer to Exhibit 20-5.Assume that the seller of X increases the price from $1.50 to $2.00,and this results in an increase in total revenue.Which of the graphs represents the demand curve for X?
A) (1)
B) (2)
C) (3)
D) all of the above
Correct Answer:

Verified
Correct Answer:
Verified
Q20: Consumers will pay the full tax that
Q62: Advertisers attempt to make the products they
Q63: The price elasticity of demand is<br>A) always
Q64: Exhibit 20-4<br> <img src="https://d2lvgg3v3hfg70.cloudfront.net/TB2061/.jpg" alt="Exhibit 20-4
Q66: It is impossible for a good to
Q94: If the price of good X rises
Q103: Government wants to maximize its tax revenue
Q187: How does price elasticity of demand vary
Q193: If the cross elasticity of demand coefficient
Q197: A normal good is<br>A)any good that consumers