Multiple Choice
Exhibit 20-5
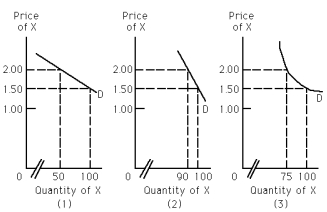
-Refer to Exhibit 20-5.Which of the graphs represents a greater percentage change in quantity demanded than the percentage change in price?
A) (1)
B) (2)
C) (3)
D) (2) and (3)
Correct Answer:

Verified
Correct Answer:
Verified
Q58: If income elasticity of demand for a
Q141: Cross elasticity of demand measures consumer responsiveness
Q178: Provide an economic explanation for why many
Q180: If Jack bought 21 CDs last year
Q181: If Cassandra bought 12 blouses last year
Q183: Demand is inelastic,so it follows that if
Q184: Exhibit 20-5<br> <img src="https://d2lvgg3v3hfg70.cloudfront.net/TB2061/.jpg" alt="Exhibit 20-5
Q185: Exhibit 20-3<br> <img src="https://d2lvgg3v3hfg70.cloudfront.net/TB2061/.jpg" alt="Exhibit 20-3
Q187: Price rises from $10.19 to $10.29 and
Q202: The longer the period of time consumers