Multiple Choice
Exhibit 21-7
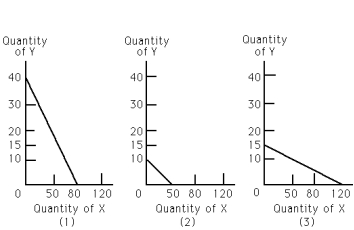
-Refer to Exhibit 21-7.Which of the following graphs represents a budget constraint of a consumer whose income is $120?
A) (1)
B) (2)
C) (3)
D) (1) and (2)
E) This cannot be determined from the information provided.
Correct Answer:

Verified
Correct Answer:
Verified
Q62: Dan is currently consuming 10 Cokes and
Q88: The marginal utility curve for units 6
Q129: The absolute value of the slope of
Q131: If total utility of a good is
Q157: Exhibit 21-1<br> <img src="https://d2lvgg3v3hfg70.cloudfront.net/TB2061/.jpg" alt="Exhibit 21-1
Q158: Suppose you just finished your third plateful
Q158: Exhibit 21-3<br> <img src="https://d2lvgg3v3hfg70.cloudfront.net/TB2061/.jpg" alt="Exhibit 21-3
Q159: Describe some of the findings of behavioral
Q164: In the Texas A & M study
Q169: Marginal utility is<br>A)the extra satisfaction derived from