Multiple Choice
Below is a Lineweaver-Burk plot in which the axis labels have been removed. Interpret the plot to determine the vmax. 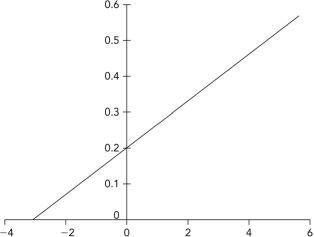
A) 0.2
B) 5
C) 3
D) 0.33
Correct Answer:

Verified
Correct Answer:
Verified
Related Questions
Q17: Which answer correctly pairs the enzyme class
Q20: Which of the following statements are true?<br>A)
Q29: Consider the reaction coordinate diagram shown
Q37: Given the following kinetic data for the
Q38: The transition state of a reaction
Q51: Explain the two ways that catalytic efficiency
Q56: An inhibitor that binds only to the
Q61: Which of the following functions as a
Q78: The dihydrolipoyl transacetylase enzyme contains a lipoyl
Q103: The mechanism of HMG-CoA reductase involves<br>A) two