Exhibit 31-1 -Refer to Exhibit 31-1.This Graph Represents a Negative Externality Situation.Given
Multiple Choice
Exhibit 31-1
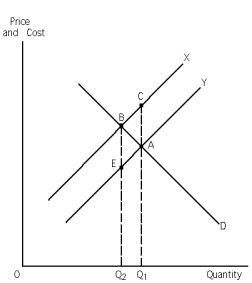
-Refer to Exhibit 31-1.This graph represents a negative externality situation.Given this,which of the two curves,X or Y,represents marginal social costs and why?
A) Curve X, because if there is a negative externality, external costs are associated with it: social costs = external costs + private costs, therefore the marginal social cost curve must lie above the marginal private cost curve.
B) Curve Y, because if there is a negative externality, negative external costs are associated with it: social costs = negative external costs + private costs, therefore the marginal social cost curve must lie below the marginal private cost curve.
C) Curve X, because if there is a negative externality, external benefits are associated with it: social costs = external benefits + private costs, therefore the marginal social cost curve must lie above the marginal private cost curve.
D) Curve Y, because if there is a negative externality, negative external benefits are associated with it: social costs = negative external benefits + private costs, therefore the marginal social cost curve must lie below the marginal private cost curve.
Correct Answer:

Verified
Correct Answer:
Verified
Q36: Suppose the optimal amount of X is
Q36: Exhibit 31-4<br> <img src="https://d2lvgg3v3hfg70.cloudfront.net/TB2061/.jpg" alt="Exhibit 31-4
Q38: Exhibit 31-5<br> <img src="https://d2lvgg3v3hfg70.cloudfront.net/TB2061/.jpg" alt="Exhibit 31-5
Q40: A consequence of a negative externality is
Q77: A negative externality is<br>A)a type of tax.<br>B)a
Q104: Moral hazard occurs when the parties on
Q115: Marginal social benefits are equal to<br>A)marginal private
Q120: Suppose the production of a good results
Q123: The free rider problem is the main
Q155: Generally, negative externalities result in<br>A)too much of