Exhibit 31-2 -Refer to Exhibit 31-2.This Graph Represents a Positive Externality Situation.Given
Multiple Choice
Exhibit 31-2
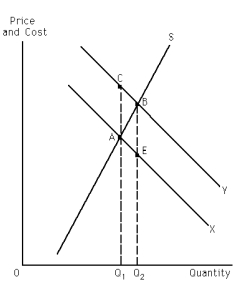
-Refer to Exhibit 31-2.This graph represents a positive externality situation.Given this,which of the two curves,X or Y,represents marginal social benefits and why?
A) Curve X, because if there is a positive externality, negative external benefits are associated with it: social costs external benefits - private benefits, therefore the marginal social benefit curve must lie below the marginal private benefit curve.
B) Curve X, because if there is a positive externality, external benefits are associated with it: social benefits = external benefits + private benefits, therefore the marginal social benefit curve must lie below the marginal private benefit curve.
C) Curve Y, because if there is a positive externality, external costs are associated with it: social benefits = external costs + private benefits, therefore the marginal social benefit curve must lie above the marginal private benefit cost curve.
D) Curve Y, because if there is a positive externality, external benefits are associated with it: social benefits = external benefits + private benefits, therefore the marginal social benefit curve must lie above the marginal private benefit curve.
Correct Answer:

Verified
Correct Answer:
Verified
Q1: Firm X pays firm Y $345 for
Q23: If private property rights were established in
Q55: Which of the following statements is true?<br>A)The
Q63: There is no market failure if<br>A)the marginal
Q80: When positive externalities are involved, the market
Q141: Exhibit 31-4<br> <img src="https://d2lvgg3v3hfg70.cloudfront.net/TB2061/.jpg" alt="Exhibit 31-4
Q143: Exhibit 31-5<br> <img src="https://d2lvgg3v3hfg70.cloudfront.net/TB2061/.jpg" alt="Exhibit 31-5
Q163: Explain why the socially optimal output is
Q166: If a negative externality exists, then there
Q168: Suppose the production of a good results