Multiple Choice
Please use the following information to answer the question(s) below.
The eight climographs in Figure 40.1 show yearly temperature (line graph and left vertical axis) and precipitation (bar graph and right vertical axis) averages for each month for some locations on Earth.Choose the climograph that best answers the question.
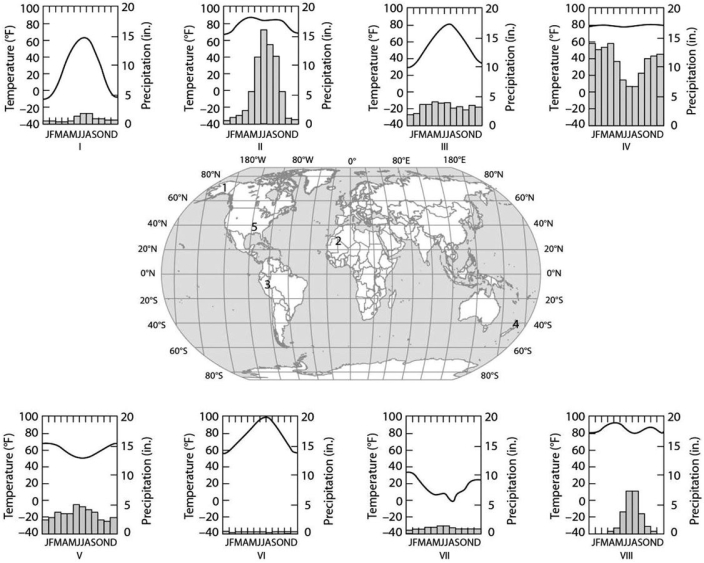 Figure 40.1
-Which climograph shows the climate for location 1?
A) I
B) III
C) V
D) VII
E) VIII
Correct Answer:

Verified
Correct Answer:
Verified
Q83: Please use the following information to answer
Q84: Which of the following is an expected
Q85: When climbing a mountain,we can observe transitions
Q86: The growing season would generally be shortest
Q87: <img src="https://d2lvgg3v3hfg70.cloudfront.net/TB7910/.jpg" alt=" Figure 40.3 -In
Q88: What is an assumption of the logistic
Q89: Trees are rare in the savanna biome
Q90: In 2008,the New Zealand population was approximately
Q91: Which of the following methods would provide
Q93: Palm trees and subtropical plants are commonplace