Multiple Choice
Please use the following information to answer the question(s) below.
The eight climographs in Figure 40.1 show yearly temperature (line graph and left vertical axis) and precipitation (bar graph and right vertical axis) averages for each month for some locations on Earth.Choose the climograph that best answers the question.
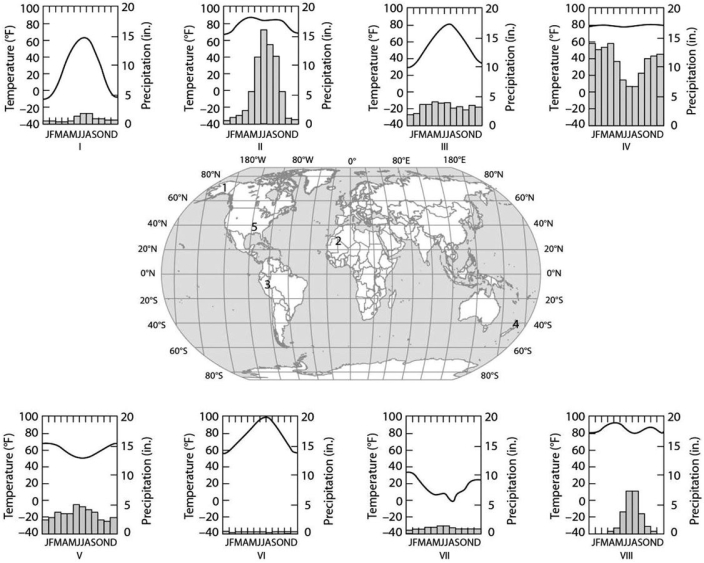 Figure 40.1
-Which climograph shows the climate for location 4?
A) I
B) II
C) III
D) V
E) VI
Correct Answer:

Verified
Correct Answer:
Verified
Q24: A population of ground squirrels has an
Q51: The three basic variables that make up
Q52: Areas where terrestrial biomes grade into neighboring
Q53: Which of the following is a physical
Q54: In models of logistic population growth,<br>A)the population
Q55: Which of the following biomes is correctly
Q57: <img src="https://d2lvgg3v3hfg70.cloudfront.net/TB7910/.jpg" alt=" Figure 40.3 -Which
Q58: Which of the following graphs illustrates the
Q59: Which of the following describes a Type
Q61: In July 2008,the U.S.population was approximately 302,000,000.If