Multiple Choice
Please use the following information to answer the question(s) below.
The eight climographs in Figure 40.1 show yearly temperature (line graph and left vertical axis) and precipitation (bar graph and right vertical axis) averages for each month for some locations on Earth.Choose the climograph that best answers the question.
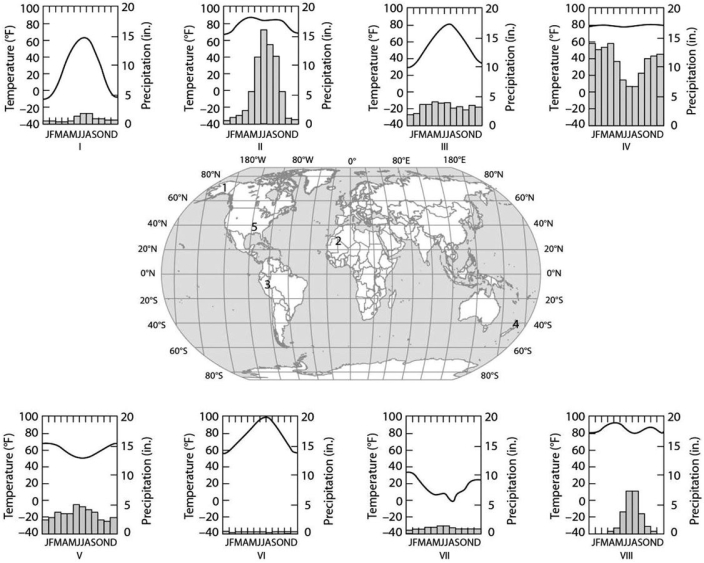 Figure 40.1
-Which climograph shows the climate for location 5?
A) I
B) III
C) IV
D) V
E) VIII
Correct Answer:

Verified
Correct Answer:
Verified
Q8: Please use the following information to answer
Q9: Consider two forests: one is an undisturbed
Q10: A population is correctly defined as having
Q11: Which of the following is an intrinsic
Q12: In mountainous areas of western North America,which
Q14: Figure 40.2 shows a generalized cross section
Q15: To construct a life table for a
Q16: Which of the following is most likely
Q17: Often the growth cycle of one population
Q18: Which of the following methods would most