Multiple Choice
Blue light is a portion of the visible spectrum that penetrates deep into bodies of water.Ultraviolet (UV) light,though,can penetrate even deeper.A gene within a population of marine fish that inhabits depths from 500 m to 1,000 m has an allele for a photopigment that is sensitive to UV light and another allele for a photopigment that is sensitive to blue light.Which of the graphs in Figure 21.1 best depicts the predicted distribution of these alleles within a population if the fish that carry these alleles prefer to locate themselves where they can see best? 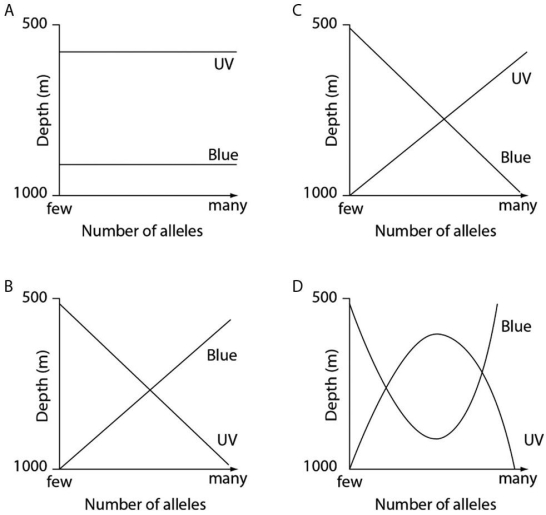 Figure 21.1
A) A
B) B
C) C
D) D
Correct Answer:

Verified
Correct Answer:
Verified
Q2: If,on average,46% of the loci in a
Q3: Which of the following is correct about
Q4: In a Hardy-Weinberg population with two alleles,
Q5: There are 25 individuals in population 1,all
Q6: Please use the following information to answer
Q8: When evolution occurred on the Galápagos Islands,the
Q9: When using the Hardy-Weinberg equilibrium model,we assume
Q10: <img src="https://d2lvgg3v3hfg70.cloudfront.net/TB7910/.jpg" alt=" Figure 21.3 In
Q11: It is estimated by a wide body
Q44: Which statement about the beak size of