Multiple Choice
Researchers obtained the data depicted in this figure by sampling human blood containing HIV and then isolating and sequencing genes within the human immunodeficiency virus's DNA .What does the y-axis represent? 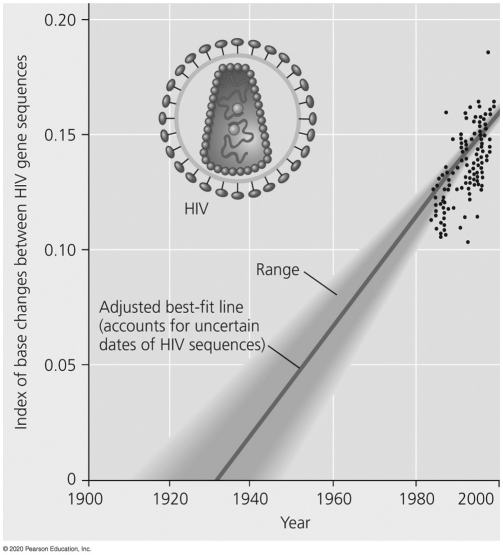
A) an index of natural selection on the HIV genes studied
B) an index of mutations within gene regions of HIV that are unrelated to the success of the virus (such as how virulent it is or how well it reproduces within its human hosts)
C) a measurement of changes between HIV gene sequences,specifically on genes important for the replication,reproduction,and spreading of the virus
D) an index of time since the first human HIV infection occurred
Correct Answer:

Verified
Correct Answer:
Verified
Q10: The next questions refer to the following
Q13: <img src="https://d2lvgg3v3hfg70.cloudfront.net/TB7910/.jpg" alt=" Figure 20.3 -In
Q14: Which statement about the relationship between phenotypic
Q15: Please use the following information to answer
Q16: A shared ancestral character is<br>A)a character that
Q17: A phylogenetic tree shows that birds and
Q19: The observation that genetic mutations in the
Q22: Analisa and Mateo,two research anthropologists interested in
Q23: <img src="https://d2lvgg3v3hfg70.cloudfront.net/TB7910/.jpg" alt=" Figure 20.1 -Using
Q51: A) that these organisms are phenotypically more