Multiple Choice
This question refers to Table 20.1,which compares the % sequence homology of four different parts (two introns and two exons) of a gene found in five different eukaryotic species.Each part is numbered to indicate its distance from the promoter (for example,intron I is the one closest to the promoter) .The data reported for species A were obtained by comparing DNA from one member of species A to the DNA of another member of species A.
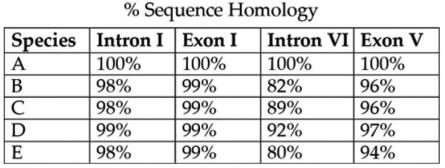 Table 20.1
-Based on the tabular data,and assuming that time advances vertically,which cladogram (a type of phylogenetic tree) is the most likely depiction of the evolutionary relationships among these five species?
A) 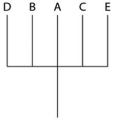
B) 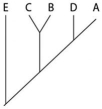
C) 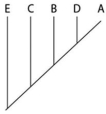
D) 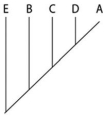
Correct Answer:

Verified
Correct Answer:
Verified
Q52: In addition to naming species,Linnaeus also grouped
Q53: Based on the tree below,which statement is
Q54: Researchers obtained the data depicted here by
Q55: You discover a fossil with feathers on
Q56: Sister taxa<br>A)represent the common ancestor of taxa.<br>B)represent
Q59: When it acts upon a gene, which
Q59: Please use the following information to answer
Q60: Scientists discovered a fossil in China that
Q62: The relative lengths of the frog and
Q72: A) that these organisms are phenotypically more