Multiple Choice
Figure 9-1
This figure shows the effect of a minimum-wage law. 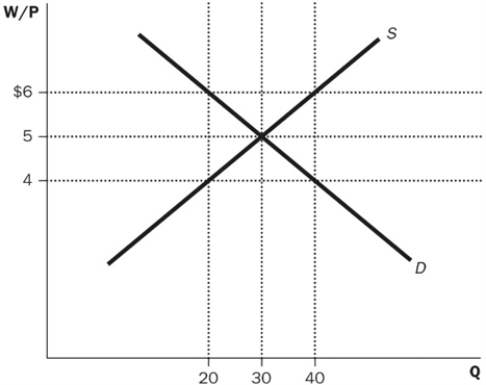
-Refer to Figure 9-1. Which of the following describes the equilibrium point in the diagram where there is an absence of the minimum-wage law?
A) $4 and 20 workers
B) $5 and 30 workers
C) $5 and 40 workers
D) $6 and 40 workers
Correct Answer:

Verified
Correct Answer:
Verified
Related Questions
Q1: From time to time, the demand for
Q2: Which law is most likely to reduce
Q3: Who would NOT be included in the
Q4: What is the most likely result of
Q6: Suppose that in 2019, the demand for
Q7: According to economists, how should the reported
Q8: Which of the following best defines gross
Q10: Which group has the highest labour-force participation
Q39: Efficiency wages create structural unemployment.
Q345: If the wage is kept above the