Multiple Choice
Figure 4-7 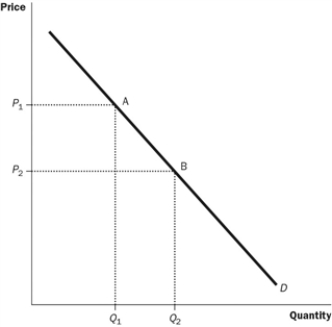
-Refer to the Figure 4-7. What does the movement from point A to point B on the graph show?
A) a decrease in demand
B) an increase in demand
C) a decrease in quantity demanded
D) an increase in quantity demanded
Correct Answer:

Verified
Correct Answer:
Verified
Q51: Which of the following will definitely cause
Q52: Figure 4-5 <img src="https://d2lvgg3v3hfg70.cloudfront.net/TB7554/.jpg" alt="Figure 4-5
Q53: Which of the following would NOT be
Q54: Figure 4-10 <img src="https://d2lvgg3v3hfg70.cloudfront.net/TB7554/.jpg" alt="Figure 4-10
Q55: Peterborough is a small university city in
Q57: <img src="https://d2lvgg3v3hfg70.cloudfront.net/TB7554/.jpg" alt=" -Refer to the
Q58: Figure 4-1 <img src="https://d2lvgg3v3hfg70.cloudfront.net/TB7554/.jpg" alt="Figure 4-1
Q59: If two goods are substitutes, what happens
Q60: <img src="https://d2lvgg3v3hfg70.cloudfront.net/TB7554/.jpg" alt=" -Refer to the
Q61: Market demand is given as Qd =