Multiple Choice
Figure 4-5 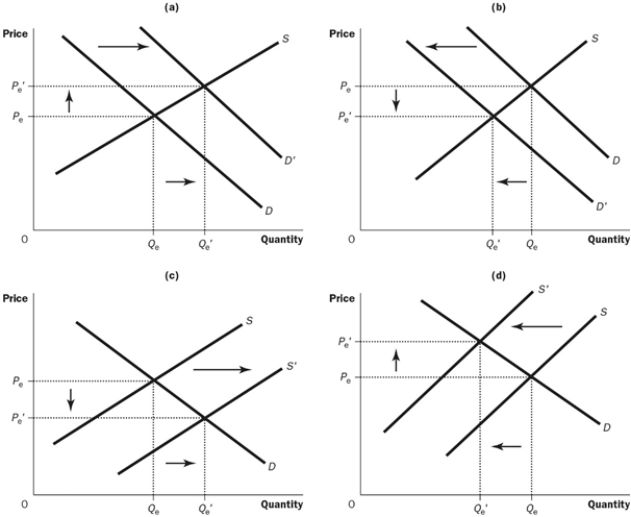
-Refer to the Figure 4-5. Which of the four graphs represents the market for back to school clothes in late August?
A) graph A
B) graph B
C) graph C
D) graph D
Correct Answer:

Verified
Correct Answer:
Verified
Related Questions
Q141: Which of the following would NOT affect
Q142: If a surplus exists in a market,
Q143: Market demand is given as Qd =150
Q144: Consider the following scenario: a new manufacturing
Q145: If a shortage exists in a market,
Q147: Peter tells you that he thinks the
Q148: Figure 4-4 <img src="https://d2lvgg3v3hfg70.cloudfront.net/TB7554/.jpg" alt="Figure 4-4
Q149: What would result from an increase in
Q150: Market demand is given as Qd =
Q151: Aluminum is an important input in the