Multiple Choice
Figure 4-5 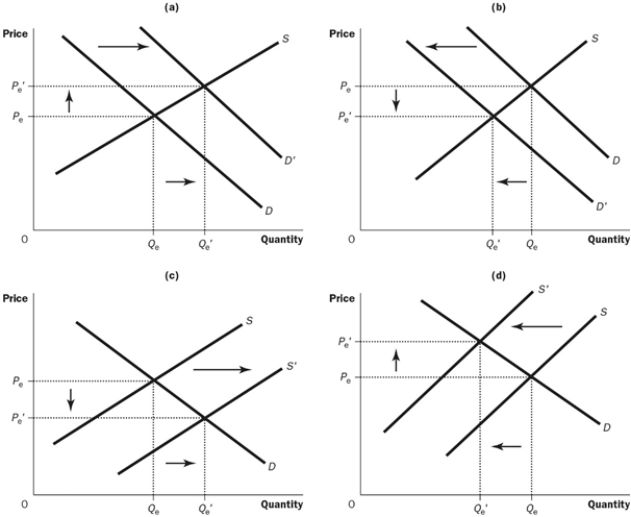
-Refer to the Figure 4-5. Which of the following is shown in Graph C?
A) a decrease in demand
B) a decrease in the number of sellers
C) an increase in supply
D) an increase in input prices
Correct Answer:

Verified
Correct Answer:
Verified
Related Questions
Q245: Figure 4-3 <img src="https://d2lvgg3v3hfg70.cloudfront.net/TB7554/.jpg" alt="Figure 4-3
Q246: Sugar is a normal good. You observe
Q247: What does the law of demand imply?<br>A)
Q248: Which of the following is NOT a
Q249: What will happen to the equilibrium price
Q251: What relationship is shown by the supply
Q252: Suppose you make jewellery. If the price
Q253: The behaviour of buyers and sellers drives
Q254: Morgan tells you that the price of
Q255: Which of the following would cause both