Multiple Choice
Figure 2-10 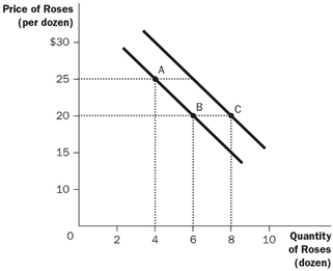
-Refer to Figure 2-10. What are the curves shown?
A) supply curves
B) demand curves
C) preference curves
D) income-consumption curves
Correct Answer:

Verified
Correct Answer:
Verified
Q50: Since natural experiments offered by history cannot
Q51: What are the two basic reasons why
Q52: Which statement is the best explanation for
Q53: What does a demand curve show?<br>A) the
Q54: How does a scientist make assumptions?<br>A) A
Q56: Figure 2-2 <img src="https://d2lvgg3v3hfg70.cloudfront.net/TB7554/.jpg" alt="Figure 2-2
Q57: Why are historical episodes valuable to economists?<br>A)
Q58: Figure 2-6 <img src="https://d2lvgg3v3hfg70.cloudfront.net/TB7554/.jpg" alt="Figure 2-6
Q59: Figure 2-1 <img src="https://d2lvgg3v3hfg70.cloudfront.net/TB7554/.jpg" alt="Figure 2-1
Q60: Which statement about slope is NOT correct?<br>A)