Multiple Choice
Figure 17-4 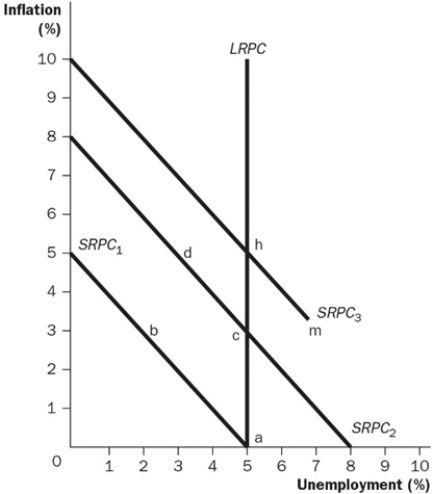
-Refer to Figure 17-4. Along SRPC2, what is the expected rate of inflation?
A) 0 percent
B) 1 percent
C) 2 percent
D) 3 percent
Correct Answer:

Verified
Correct Answer:
Verified
Q55: Discuss the advantages and disadvantages of drawing
Q56: If macroeconomic policy expands aggregate demand, unemployment
Q57: If policymakers reduce aggregate demand, what happens
Q59: Figure 17-4 <img src="https://d2lvgg3v3hfg70.cloudfront.net/TB7554/.jpg" alt="Figure 17-4
Q61: Figure 17-4 <img src="https://d2lvgg3v3hfg70.cloudfront.net/TB7554/.jpg" alt="Figure 17-4
Q62: Who is a leading economist in the
Q63: In 1980, what was the Canadian inflation
Q64: Suppose the long-run Phillips curve shifts to
Q65: Which theory proposes that people optimally use
Q134: According to the Friedman-Phelps analysis, in the