Multiple Choice
Use a graphing utility to graph the function and visually determine the intervals over which the function is increasing, decreasing, or constant. 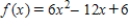
A) increasing on (-∞, ∞)
B) descreasing on (-∞, 1) increasing on (1, ∞)
C) increasing on (-∞, 1) descreasing on (1, ∞)
D) descreasing on (-∞, ∞)
E) descreasing on (1, 1) increasing on (1, ∞)
Correct Answer:

Verified
Correct Answer:
Verified
Q43: Restrict the domain of the function f
Q78: Find <img src="https://d2lvgg3v3hfg70.cloudfront.net/TB7896/.jpg" alt="Find .
Q79: Use a calculator to approximate the number.(Round
Q80: Determine algebraically whether f and g are
Q81: Find the graph of the equation.
Q82: Solve the following equation. <img src="https://d2lvgg3v3hfg70.cloudfront.net/TB7896/.jpg"
Q85: Determine whether the function has an inverse
Q86: Select the correct graph of the given
Q87: Find (f + g)(x). <img src="https://d2lvgg3v3hfg70.cloudfront.net/TB7896/.jpg"
Q88: Find the zeroes of the functions algebraically.