Short Answer
The graph of the function is sketched as follows:
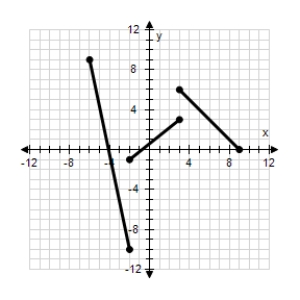
Determine the interval where the function is increasing.
Correct Answer:

Verified
Correct Answer:
Verified
Related Questions
Q364: Which graph represents the function? <img
Q365: Solve the multiple-angle equation. <img src="https://d2lvgg3v3hfg70.cloudfront.net/TB7896/.jpg"
Q366: Find the y-intercept of the line determined
Q367: Find (f - g)(x). <img src="https://d2lvgg3v3hfg70.cloudfront.net/TB7896/.jpg"
Q368: Use inequality notation and interval notation to
Q370: Select the graph of the function and
Q371: Select the graph of f and f<sup>-1</sup>
Q372: Use the Quadratic Formula to solve the
Q373: Find all solutions of the following equation
Q374: Select the graph of the function and