Multiple Choice
The graph shows the sales (in billions of dollars) for Apple Inc.for the years 2001 through 2007. 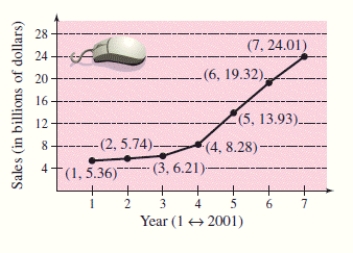 Find the slope of the line segment connecting the points for the years 2003 and 2004.Round the answer to two decimal places.
A) -5.07
B) 2.07
C) 7.07
D) 3.07
E) -2.07
Correct Answer:

Verified
Correct Answer:
Verified
Q148: Write the number in decimal notation. <br>Interior
Q149: An object is thrown upward from a
Q150: Find <img src="https://d2lvgg3v3hfg70.cloudfront.net/TB7896/.jpg" alt="Find .
Q151: Select the graph of the function and
Q152: Find the difference quotient and simplify your
Q154: Solve the following equation. <img src="https://d2lvgg3v3hfg70.cloudfront.net/TB7896/.jpg"
Q155: Select the graph of the given function
Q156: Assume that the graph has Origin symmetry.Select
Q157: Find <img src="https://d2lvgg3v3hfg70.cloudfront.net/TB7896/.jpg" alt="Find .
Q158: Restrict the domain of the function f