Multiple Choice
Graphically estimate the x- and y-intercepts of the graph. 
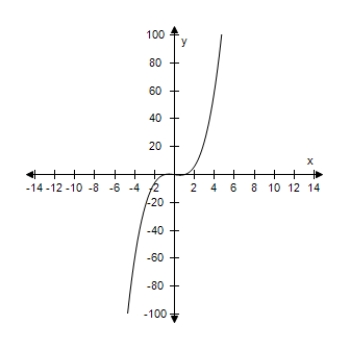
A) x-intercept: (±1, 0) , (0, 0) y-intercept: (0, 0)
B) x-intercept: (1, 0) , (0, 0) y-intercept: (0, 0)
C) x-intercept: (-1, 0) , (0, 0) y-intercept: (0, 0)
D) x-intercept: (0, ±1) , (0, 0) y-intercept: (0, 0)
E) x-intercept: (0, 1) , (0, 0) y-intercept: (0, 0)
Correct Answer:

Verified
Correct Answer:
Verified
Q16: Evaluate g(s + 2)if g(y)= 12 -
Q20: Find the x-intercept of the graph of
Q32: Evaluate S(3)if S(r)= 4πr<sup>2</sup>.<br>A)S(3)= 40<br>B)S(3)= 9<br>C)S(3)= 38<br>D)S(3)=
Q335: Write the number in decimal notation. ?<br>4)25
Q336: Use a calculator to approximate the number.(Round
Q337: Use absolute value notation to describe the
Q338: Use a calculator to evaluate the expression.(Round
Q339: Sketch the subset on the real number
Q341: Find the inverse of the one-to-one function.<br>
Q345: Complete the following statement using the appropriate