Multiple Choice
The figure below shows a family of cost curves for a firm.The subscripts 1,2,and 3 for the SRATC curves refer to different plant sizes.
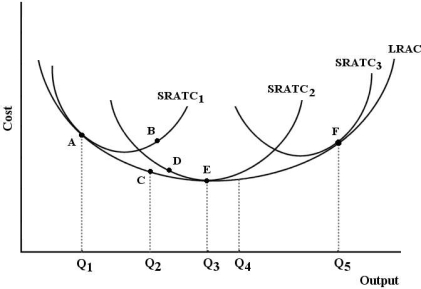 FIGURE 8-3
-Refer to Figure 8-3.The minimum efficient scale is achieved by this firm at output level
A) Q1.
B) Q2.
C) Q3.
D) Q4.
E) Q5.
Correct Answer:

Verified
Correct Answer:
Verified
Related Questions
Q9: Consider a firm that uses only labour
Q11: Assume a firm is using 6 units
Q24: The following table shows the marginal products
Q25: An individual isocost line is a downward
Q31: Suppose that capital costs $100 per unit
Q34: When a cost-minimizing firm is faced with
Q67: What information is displayed by an isoquant?<br>A)the
Q122: A change in the technique for producing
Q124: Suppose capital costs $280 per unit and
Q138: When a firm seeks to minimize costs