Multiple Choice
The figure below shows a family of cost curves for a firm.The subscripts 1,2,and 3 for the SRATC curves refer to different plant sizes.
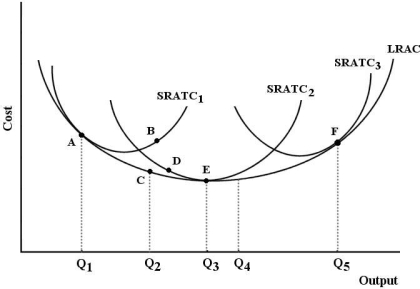 FIGURE 8- 3
-Refer to Figure 8- 3.If this firm is producing at point B,then
A) this firm is experiencing decreasing returns to scale.
B) it should employ more of its variable factors of production.
C) plant size 1 is optimal.
D) this firm is producing a level of output that is technically inefficient in the long run.
E) this firm could produce the same level of output at a lower cost with plant size 2.
Correct Answer:

Verified
Correct Answer:
Verified
Q18: <img src="https://d2lvgg3v3hfg70.cloudfront.net/TB5441/.jpg" alt=" FIGURE 8-4 -Refer
Q23: Suppose that capital costs $10 per unit
Q24: The figure below shows the isocost lines
Q25: The slope of a firm's isocost line
Q26: The figure below shows the isocost lines
Q27: Refer to Figure 8- 6.Suppose the firm
Q31: The figure below shows the isocost lines
Q32: The following table shows the marginal
Q33: The fact that new methods to extract
Q130: The figure below shows the isocost lines